Last update 14/09/2019
Although the focus for IFRS 9 Financial Instruments is on financial institutions such as banks and insurance companies, ‘normal’ operating entities are also affected by IFRS 9. Maybe their investment and loan portfolios are less complex but in operating a business and as part of the internal credit risk management practice policy making it is still important to implement the impairment model under IFRS 9 Financial Instruments. This is step 6 following the Simplified approach which started with an introduction in Impairment of investments and loans.
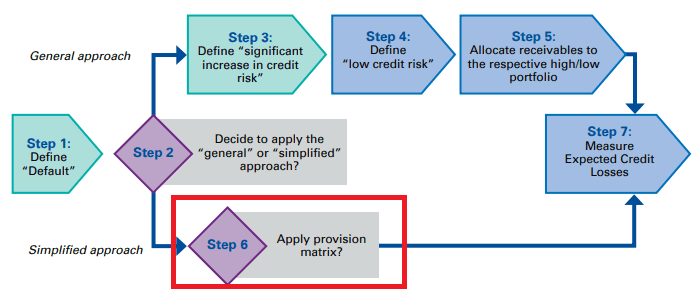

For trade receivables, a reporting entity can use a provision matrix as a practical expedient for measuring Expected Credit Losses (ECL).
An example is as follows:
Company T has a portfolio of trade receivables of EUR 30,000 at the reporting date. None of the receivables includes a significant financing component (otherwise these would have to be excluded from the matrix calculation, since there is a reward included in such instruments). T operates in one geographic region and has a large number of small customers. This immediately leads to possibilities to sophisticate the provision matrix, different provision matrices may be used for different countries, geographic regions, thresholds in the size of the outstanding amount, turnover days of each receivable, etcetera.
T uses a provision matrix to determine the lifetime ECL for the portfolio. It is based on T’s historical observed default rates, and is adjusted by a forward-looking estimate that includes the probability of a worsening economic environment within the next year. At each reporting date, T updates the observed default history and forward-looking estimates.
|
Aging of receivables |
Expected credit loss |
Trade receivable (EUR) |
Impairment allowance (EUR) |
|
Current |
0,5% |
15.000 |
75 |
|
1- 30 days past due |
2,2% |
7.500 |
165 |
|
31 – 60 days past due |
2,7% |
4.000 |
108 |
|
61 – 90 days past overdue |
4,5% |
2.500 |
112 |
|
Over 90 days past due |
10,0% |
1.000 |
100 |
|
Total |
30.000 |
560 |
Ways to improve the provision matrix approach (in addition to ones mentioned above) are:
- consider to segment trade receivables based on common risk categories, for example:
- geographical region,
- product type sold,
- internal customer rating,
- collateral or trade credit insurance,
- type of customer, such as wholesale or retail,
- Gather historical loss information by age band for an acceptable period for each segment (for example 3 – 5 years),
- Adjust any historical losses that are not representative of future credit losses, for example write offs due to billing system errors, discounts or rebates,
- Compute preliminary average historical loss rate by age band,
- Adjust the preliminary average historical loss rate:
- to incorporate all reasonable and supportable information about current conditions of the debtors and the general economic conditions, and
- for reasonable and supportable forecasts of future macro-economic indicators that the (group of) financial instruments are sensitive to for example:
- unemployment rates, Step 6 Apply the provision matrix
- GDP Step 6 Apply the provision matrix
- property prices, Step 6 Apply the provision matrix
- commodity prices,
- payment status, or
- other factors that are indicative of credit losses.
- Consider if specific allowance on an individual basis should be made for any receivables where specific information is available. Apply the adjusted loss rate to the remaining balances (excluding low credit rated receivables and specifically impaired receivables) on a collective basis in each segment.
After ‘Applying the provision matrix’ you can still go to Step 7 Measure Expected credit losses or go to Step 3 Define ‘significant increase in credit risk’ to use the General approach to other financial assets.
Or jump to:
Step 1 Define Default, Step 2 Decide to use the general or simplified approach, Step 4 Define low credit risk, Step 5 Allocate receivables to high and low credit risk, Step 6 Apply the provision matrix