Last update 26/11/2019
Valuation of shares and the enterprise shows the calculations of the valuation of a company through the valuation of its shares (or shareholders’ equity) or of the enterprise (shareholders’ equity minus excess liquidity plus third party debt). The Discounted cash flow calculation method is an income-based approach to valuation that is based upon the theory that the value of a business is equal to the present value of its projected future benefits (including the present value of its terminal value).
The terminal value does not assume the actual termination or liquidation of the business, but rather represents the point in time when the projected cash flows level off or flatten (which is assumed to continue into perpetuity). The amounts for the projected cash flows and the terminal value are discounted to the valuation date using an appropriate discount rate, which encompasses the risks specific to investing in the specific company being valued. Inherent in this method is the incorporation or development of projections of the future operating results of the company being valued.
Distributable cash flow is used as the benefit stream because it represents the earnings available for distribution to investors after considering the reinvestment required for a company’s future growth. The discounted cash flow method can be based on the cash flows to either a company’s equity or invested capital (which is equal to the sum of a company’s debt and equity).
A “direct to equity” discounted cash flow method arrives directly at an equity value of a company while a “debt-free” discounted cash flow method arrives at the invested capital value of a company, from which debt must be subtracted to arrive at the company’s equity value. A brief summary of some of the primary differences between a “direct to equity” and a “debt-free” discounted cash flow analysis are presented below:
| Valuation of shares and the enterprise |
Direct to equity |
Direct to long-term investment |
|
Interest expense and changes in debt |
Included in cash flow streams to project cash flow to equity investors |
Excluded from cash flow streams to project cash flow to equity and debt investors |
|
Discount rate |
Equity discount rate |
WACC – takes into account the required rates of return for debt and equity |
|
Estimated fair value (see below Financial position) |
Equity value/shares |
Invested capital value (equity and debt) |
Altered Financial position for discounted cash flow calculations (in CU’000)
| Valuation of shares and the enterprise |
CU ‘000 |
|
Non-current assets |
274,620 |
|
Current assets (excluding cash) |
137,518 |
|
TOTAL ASSETS |
412,138 |
|
Current liabilities |
78,211 |
|
Long(er) term provisions |
68,501 |
|
Invested capital (capital employed) |
265,426 |
|
Non-current debt |
194,102 |
Interest rate: 0.8% |
|
Marketable securities (debit position) |
-17,080 |
Valuation of shares and the enterprise |
|
Cash position (debit position) |
-28,938 |
Valuation of shares and the enterprise |
|
Shareholders’ equity |
117,342 |
Equity value: Equity discount rate 28.3% |
|
EQUITY MINUS EXCESS LIQUIDITY PLUS NON-CURRENT LIABILITIES |
265,426 |
Invested capital value: WACC 11.161% (see below) |
WACC = [(194,102 * 0.8%) + (117,342 * 28.3%)] / (194,102 + 117,342) =
= (1,553 + 33,208) / 311,444 = 11.161%
See above the altered financial position for the numbers!
Here are the print screens from the discounted cash flow calculation for the equity value/shares and invested capital value (equity and debt):
Overview Net free cash flow to equity
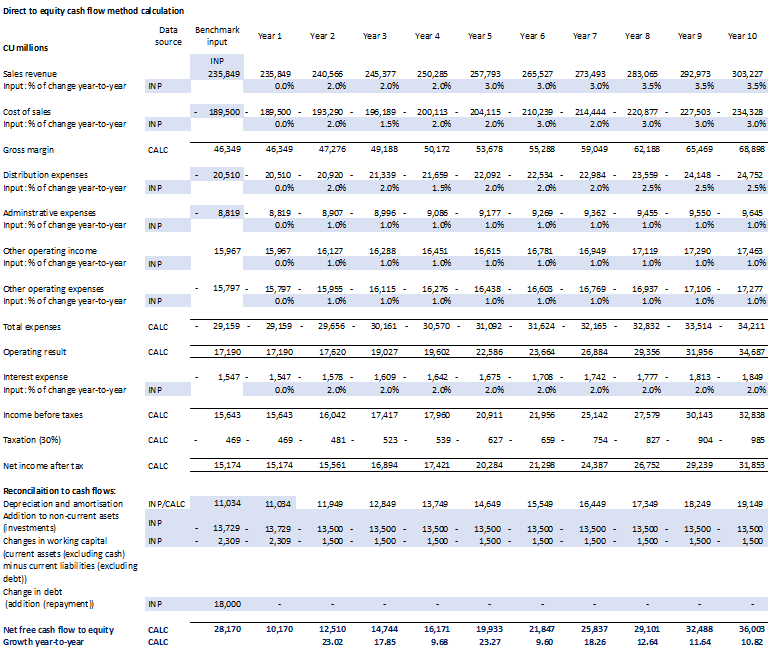
 Note: the last two rows (Net free cash flow to equity and Growth year-to-year) are replicated to the second part of the print (ie it is one spreadsheet))
The calculation of the equity value part:
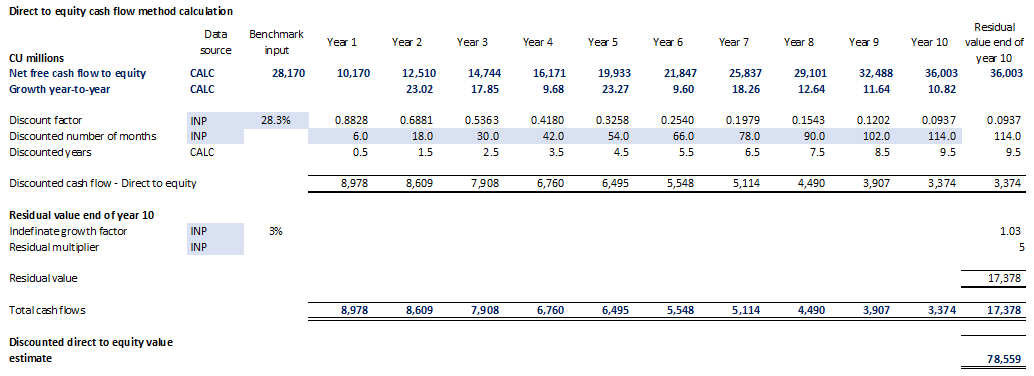
 Note: the first two rows (Net free cash flow to equity and Growth year-to-year) are replicated from the first part of the print (ie it is one spreadsheet))
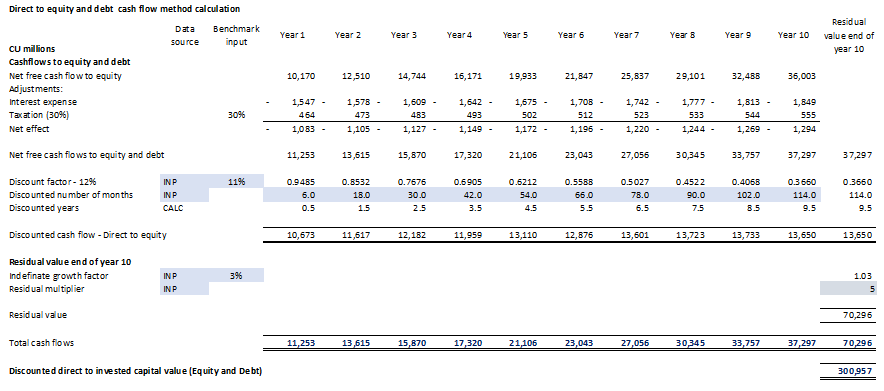
The calculation of the Invested capital value (equity and debt) part:
(Starts with the same ‘Net free cash flows to equity’ and adjusts it to cash flows to equity and debt)

Summarising things:
See the summaries below for the numbers, here is a qualification. With the modelled case there is little interpretation and investigation possible. Here two methods are provided to allocate the enterprise value to Non-current debt and the Net equity position.
Method 1 allocates the enterprise value to both components, doing so implies the potential acquirer (whose working sheets these are) is of the opinion that the value of the non-current debt is of value to the potential acquirer (for its financing arrangements, collateral, interest or redemption conditions).
Method 2 allocates the excess of enterprise value over the carrying value of Non-current debt to the net equity position, doing so implies non-current debt can be easily replaced by comparative conditioned debt or even better conditioned debt by the potential acquirer.
In addition netting the excess liquidities with equity implies it will be used for repayment of debt or pay-out to shareholders. However these are just suggestions based on the limitation of such a model.
| Valuation of shares and the enterprise |
Amounts from altered financial position |
DCF values method 1 |
DCF values method 2 |
|
A Non-current debt |
194,102 |
222,3981 |
194,1022 |
|
Equity and excess liquidity: |
|||
|
Marketable securities (debit position) |
-17,080 |
||
|
Cash position (debit position) |
-28,938 |
||
|
Shareholders’ equity |
117,342 |
||
|
B Net equity position |
71,324 |
78,559 |
106,855 3 |
|
A + B Total |
265,426 |
300,957 |
300,957 |
See also: The IFRS Foundation